I believe JeffJo probably typo'd there and meant to say that the 212HP number may be some theoretical maximum when the mechanical linkage is engaged and the electric motor is also producing its maximum drawing from the battery.
No, I meant exactly what I typed.
The 181 HP rating for the drive motor applies when the clutch is not engaged, and is drawing electric power from the electrical system that is built into the car. This information alone does not indicate whether or not some of that power is drawn from the ICE+generator, but later inferences seem to answer that question.
It is interesting that those dyno graphs ...
They are simulated graphs. Read the header above the figure:
"The Horspower / Torque Curve below was generated by the ProfessCars™ software, based on the factory data". No dynamometer data was used. The low end is obviously based on the 232.2 lb-ft rating of the same drive motor, sans ICE. What I'm trying to decipher is how the high-end was determined, and if it should be determined some other way.
The following is for the Accord, but the fact that the same things happen for the Clarity, based on its numbers, supports my inferences. My educated guess is that they took the statements in the spec, "232 lb.-ft @ 0-2000 rpm" and "181 @ 5000-6000 rpm" to literally mean the drive motor's torque drops off from 232.2 lb-ft at 2000 rpm to 190 lb-ft (and so 181 HP) at 5000 rpm. And that
if they could work together at the same speed, which they don't, the drive motor and ICE achieve a combined 212 HP at 6200 rpm. All that simulated dyno curve does, is connect these three pieces of information.
But
from Figure 18 of the paper referenced in the first post of this thread, and the more detailed version of the same figure that I posted, we know that data was incomplete. Those figures were for an earlier version of the drive motor, but it is clear that the same plot for the current version (and I have seen it in later papers) would show that the drive motor has 232.2 lb-ft from 0 to 4094 rpm, and T=(181*5252/RPM) lb-ft from 4094 rpm to some maximum speed around 12500 rpm. This plot is obviously generated from specified limits, and not a dynamometer. But still unclear, again based on the information so far in this post, how the ICE combines with that curve to make 212 HP, and what the car's speed is when it applies.
I described what actually happens with, and without, the clutch engaged earlier. For reference, the speed of the car in mph is (drive motor rpm)/113 and, when the clutch is engaged, (ICE rpm)/37. But since we know that the clutch is never engaged at low speeds, or when power is required at high speeds, it is not possible for the 212 HP @ 6200 rpm figure to apply to when the clutch is engaged. This proves that the drive motor is capable of producing more that 181 HP, and that it is not hard-wired to a specific drive motor speed.
The 181 HP must be derived from a power limit of the battery system alone. The 212 HP is the maximum the ICE+generator can add to that 181 HP. Since they can produce 143 HP in the Accord, and 103 HP in the Clarity, yet still add up to the same 212 HP, it seems clear that not all of the theoretical electrical power can be used to propel the car.
So my conclusions are:
- Either the battery system alone can't produce more current than what is required to make 232.2 lb-ft of torque, or the drive motor can't accept more than that current.
- The battery system alone can't produce more power than 181 HP = 135 kW.
- This has nothing to do with capacity; but my 1.3 kWh battery can't do it for more than 6 minutes
- The drive motor can't accept more than 212 HP from the combined battery+ICE+generator.
- As a mostly irrelevant point, the torque/HP curve of these cars should be plotted based on the drive motor's rpms, not the ICE's. It's 3.05 times faster.
- It looks much like that figure 18. Exactly what it looks like depends on the answer to the question suggested in conclusion #1.
+++++
clearly the RPM number associated with the torque curve is not in any way related to actual output of the ICE
Clearly the curve itself is, since its maximum is at the max-rpms of the ICE. Just as clearly, it shouldn't be. That curve is pretty meaningless.
Horsepower, while it technically means the same thing in both cases, is not a directly equivalent metric for a variety of factors, just as you can't really compare a diesel ICE to a gas ICE based only on horsepower, or even two identical ICEs with significantly different transmissions attached.
If you compare two ICE's with similar architecture, the max-HP point should give you a good approximation to how the two compare in any one set of circumstances. Comparing different ICEs makes a poor approximation, but still has some applicability. Comparing them to an EV is mext to meaningless.
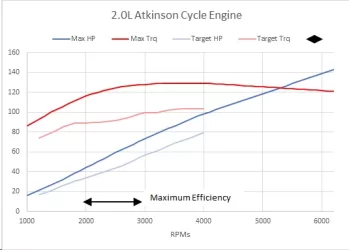
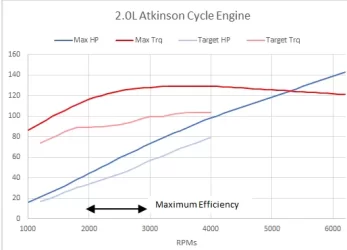
BTW, here is an approximation of my ICE's curve; I eyeballed it from a low-resolution plot, but it did have the axes labeled. It only went up to 4000 rpm, so I interpolated out to the maximum 142 HP @ 6200 rpm. I also included the points that the computer will aim for based on the power it wants from the generator.