janusz Grabon
Member
Pid 220101 what should use instead?What are the names of the pids you are using?
Pid 220101 what should use instead?What are the names of the pids you are using?
Thinking about that, what you've calculated is the portion of the "90% capacity retention" cycles that you have "used up", rather than the absolute SoH that a Leaf owner might quote.... This would represent a 2% degradation based on a 3000 charge life cycle.
This works on Android 9 so will work on Android 10. It works with the car turned on, maybe not with it off.Do I have to do this in a car or not
Do I have to do this changes in a running or not ?
I’ll take that back, while it appears to work on any Android version, it doesn’t do what you would expect, which is a straight conversion.This works on Android 9 so will work on Android 10. It works with the car turned on, maybe not with it off.
Note that the data is converted correctly, but the label underneath is NOT automatically changed. To change the label, delete the dashboard gauge then reload it.
 by battery use.webp")
 by battery acumulated energy flows.webp")
I'm currently working on a personal project to use an esp32 (ttgo t-display) to read pids and display them with other calculated values. I'm calculating the net energy used (CED-CED) like you do as well as the net capacity used(Ah) (CDC-CCC). I calculate the expected net energy used for 100% soc and the same for the expected net capacity used. I'm very closed to be able to save the values realtime to a google sheet but can still display the values on the esp32 while driving.Graph revised for clarity. As mentioned, the two 64 numbers appear when the NET output curve is linearised. That tells us something about the battery capacity represented by the displayed SoC that should be no surprise, namely that 100% is essentially 64 kWh.
I see also that on two of those downhills I recovered about 1% from regen.
View attachment 10397


 )
)


Very interesting analysis. I like your analogy example.Thinking about this question over the last few days, I don't have any suitable data yet to confirm the lack of correlation of net cumulative energy to SoC at lower SoCs because until now I've ignored the cumulative current values in all data I've collected. Yesterday I logged the data over a limited mid-SoC range and it shows (FWIW) that both match approximately. It's true that SoC has been defined as both Ah or energy in the industry literature I've read, however I haven't found any basis for why one or the other would be preferable. But, it must be accepted in principle that it's the product of current and voltage that provides the energy to move the car down the road. As pack voltage is reduced with loss of SoC, more current must be provided to maintain the same power output.
Mulling over this quandary, it seems to me that the cumulative current odometers are not affected by battery working losses, but only deterioration. E.g., the max pack capacity in Ah is available irrespective of cycles until the BMS-defined working capacity runs out of reserve and has to accept the onset of deterioration.
If I use a 180 litre tank of water as an analogy, that volume or any portion can be added or removed over and over without any change in the total maximum tank volume. That cumulative volume change would make it a good representative of SoC if energy linearity was not a consideration as the water pressure is lower at lower tank volumes.
On the other hand, considering energy, there are flow losses which means energy is lost whenever water is added or removed from the tank. The cumulative energy odometers capture this because pack voltage sags and rises on discharge and charge, respectively, due to normal battery resistive losses. Those energy odometers of course represent a realtime calculation based on instantaneous (signed) current and pack voltage sampled at some rate (perhaps in milliseconds) and integrated over time and added to each of the two registers as the current direction dictates.
So, if plotted over the batteries (BMS-defined) full-capacity lifetime, the two energy odometer values will diverge over time because those losses accumulate, but in-theory the current odometers won't. (Noting that once deterioration kicks in the divergence of the two cumulative current values could provide a way to quantify deterioration.)
But, if the energy odometers were used to determine SoC, over many cycles they would lose track of the true value and a recalibration would be required, perhaps from open-circuit pack voltage and historical data. Although the raw data would represent the available energy at any time, it would drift off depending on how aggressive the cycling is between calibrations. I've realized this in the past but have assumed that there is more than enough historical data to accomplish this.
So, I'll have to do another 300 km data-collection trip and delve into the SoC values under 25% that I normally avoid. Meanwhile, from yesterday, in the graph below of Net values from 66 to 54% (SoC dsip), the (Ah) orange line's slope is near the 180 Ah value when the SoC(BMS) is used while the (kWh) blue line is near the 64 kWh value when the SoC(displayed) is referenced. That doesn't entirely surprise me because the understood 60Ah per-cell rating may be the base capacity rather that the BMS-defined useful capacity.
View attachment 10432
Very good analysis and I like your analogy to a tank of water.Thinking about this question over the last few days, I don't have any suitable data yet to confirm the lack of correlation of net cumulative energy to SoC at lower SoCs because until now I've ignored the cumulative current values in all data I've collected. Yesterday I logged the data over a limited mid-SoC range and it shows (FWIW) that both match approximately. It's true that SoC has been defined as both Ah or energy in the industry literature I've read, however I haven't found any basis for why one or the other would be preferable. But, it must be accepted in principle that it's the product of current and voltage that provides the energy to move the car down the road. As pack voltage is reduced with loss of SoC, more current must be provided to maintain the same power output.
Mulling over this quandary, it seems to me that the cumulative current odometers are not affected by battery working losses, but only deterioration. E.g., the max pack capacity in Ah is available irrespective of cycles until the BMS-defined working capacity runs out of reserve and has to accept the onset of deterioration.
If I use a 180 litre tank of water as an analogy, that volume or any portion can be added or removed over and over without any change in the total maximum tank volume. That cumulative volume change would make it a good representative of SoC if energy linearity was not a consideration as the water pressure is lower at lower tank volumes.
On the other hand, considering energy, there are flow losses which means energy is lost whenever water is added or removed from the tank. The cumulative energy odometers capture this because pack voltage sags and rises on discharge and charge, respectively, due to normal battery resistive losses. Those energy odometers of course represent a realtime calculation based on instantaneous (signed) current and pack voltage sampled at some rate (perhaps in milliseconds) and integrated over time and added to each of the two registers as the current direction dictates.
So, if plotted over the batteries (BMS-defined) full-capacity lifetime, the two energy odometer values will diverge over time because those losses accumulate, but in-theory the current odometers won't. (Noting that once deterioration kicks in the divergence of the two cumulative current values could provide a way to quantify deterioration.)
But, if the energy odometers were used to determine SoC, over many cycles they would lose track of the true value and a recalibration would be required, perhaps from open-circuit pack voltage and historical data. Although the raw data would represent the available energy at any time, it would drift off depending on how aggressive the cycling is between calibrations. I've realized this in the past but have assumed that there is more than enough historical data to accomplish this.
So, I'll have to do another 300 km data-collection trip and delve into the SoC values under 25% that I normally avoid. Meanwhile, from yesterday, in the graph below of Net values from 66 to 54% (SoC dsip), the (Ah) orange line's slope is near the 180 Ah value when the SoC(BMS) is used while the (kWh) blue line is near the 64 kWh value when the SoC(displayed) is referenced. That doesn't entirely surprise me because the understood 60Ah per-cell rating may be the base capacity rather that the BMS-defined useful capacity.
View attachment 10432
I don't understand your explanation of what you're trying to achieve but it appears you may have misinterpreting how to use the CEC and CED odometers. You don't use the absolute values to determine the energy use over a trip, only the change in those values, which is why I refer to those as delta CEC and CED.
So, at the trip start record those two values and subtract them from the corresponding values at the end. Then subtract the delta CEC from the delta CED to get the net change in cumulative energy for that trip.
The other reliable and relevant number from the car is the distance driven and so from that you can calculate kWh/100km which totally ignores battery losses much as the car's readouts appear to do, i.e. it's not an overall efficiency (including charging losses) that could be compared with the car's economy rating.
As for SoC, we're discussing what that means and as such it appears so-far that it's a questionable indicator of battery energy level.

@KiwiME
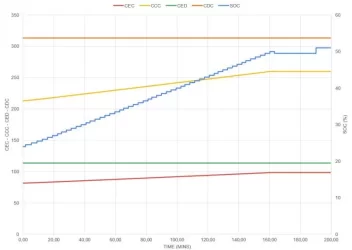
I recorded my charge to 50% today and left the recording running after the charge was done. The soc came down to 49.5% after a couple of minutes but after about 30mins the soc instantaneously moved to 51% with no change in CEC nor in CCC.
Could this be the SOC calibration you are suggesting?

How to modify Pid for indoor temp only ,shows and read in F not C .thanksI’ll take that back, while it appears to work on any Android version, it doesn’t do what you would expect, which is a straight conversion.
Instead it treats the raw numeral as an F value (i.e. 23F not 23C), then converts that to C, so 23C gets converted to -5C!! Not useful...
Thanks for posting the graph. All I can suggest is that while the battery is in use by driving or charging the cumulative registers provide information that the SoC can use to evaluate a relative change, as we've seen in our data.@KiwiMECould this be the SOC calibration you are suggesting?
If using Torque Pro you go toHow to modify Pid for indoor temp only ,shows and read in F not C .thanks