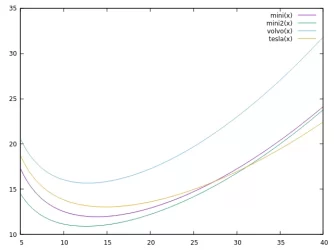
So I was bored and haven't burdened everyone with maths for a while, so...... To put the issue to rest, here are some plots for various cars - 2 for the MINI which show what weight and Cd do. Efficiency when cruising is > 95% so I ignored that. All cars have similar tyres at 0.015 rolling resistance, and a hotel load (accessories) of 2kW. The fourth trace is a MINI with only 1.5kW for demonstration purposes. The X axis is m/s, so we go to about 150kph. It is surprisingly accurate when comparing to published figures, and my own records. So what does it show? The Volvo isn't much bigger in area (mini = 2.1, tesla = 2.22, volvo = 2.5) and has similar Cd to the MINI (0.319 vs 0.3) but much worse than the tesla (0.23). The wieghts are 1365kg for the MINI, 1730 for the Tesla and 2154 for the volvo. Each has an 85kg passenger (person plus luggage).
So what do we see. The MINI (purple) is the most efficient until almost 100kph. The volvo is always around 5kWh/100km above the mini, and the tesla is about 1.5 above at slow speeds, but catches up as the speed increases. The bottom (green) line is the MINI with only 1.5kW accessories. This shows that weight and accessory load is king at slow speed, and drag takes over at higher speed. It must be noted, that air friction isn't as important as most people would suggest. The weight (ie volvo vs MINI) is the biggest difference. Incidentally, this graph is pretty accurate according to reported stats for all three cars (good guesses).
So around town, weight and accessories (aircon/heater) is what determines efficiency, and drag really only comes into play at high speeds. Incidentally, the MINI and Tesla cross at almost exactly 100kph. So under 100kph, the MINI is more efficient, at over 100kph, the Tesla is. Oh, I assumed 1.2kg/m^3 for air density which is about right for 25C and standard 1ATM. Cooler air is more dense, so the air friction will increase by about 10% with a 27C drop.
Still with me (not asleep)? Enjoy....
View attachment 19981