I have been following BEV sales since 2018 when we bought two of the electric cars in the profile picture. At that time Inside EV's was tracking BEV and PHEV sales, mainly in articles written by Mark Kane based on automakers reports. I was and still am mostly interested in BEV sales so I started my own spreadsheet, just for my own fun and information, and have been keeping it up as best as I can with reported numbers from Mr. Kane's articles. Also along with other seemingly non-biased websites like GoodCarBadCar
https://www.goodcarbadcar.net/2024-u-s-auto-sales-figures-by-model-all-vehicle-ranked/ .
Part of my challenge is that some automakers US sales numbers are reported monthly (Toyota, Honda, Ford, Hyundai/Kia/Genesis, Volvo etc listed in the current Good Car Bar Car tally), some are only listed quarterly (Tesla, VW, GM, BMW, Mercedes, etc.), Tesla does not split US sales out by specific model, Rivian only reports total sales and does not split out US sales and some do not report BEV (or PHEV for that matter) sales separately for models that offer more than one options between BEV, PHEV, HEV, or ICE. The Kia Niro, Hyundai Kona, and Mini E are good examples of this.
For some of those earlier years the US government did report a total for each vehicle model (BEV and PHEV) by registration, and Mark Kane does still report on this as well, but only on most of the top automakers. From what I have seen, some numbers reported by one source are different from others. Probably because they have to do some estimating and thus different sources have different numbers. As a result of all of this my spreadsheet is no more than a sophisticated wild guess, however, I press on just for fun or until it is not fun anymore.
All that said I feel like the most important number to me is not the percentage of new car sales in any specific month, quarter, or even year. To me the most important number is how many BEV's are on the road. Anecdotally I am seeing BEV's than ever more in my neighborhood, and in my travels. Fortunately there is a US Department of Energy Alternative Fuels Data Center (AFDC) website for this. Since the last time I checked a few weeks ago, the website was updated to include 2023 registration counts by state and fuel type
https://afdc.energy.gov/vehicle-registration
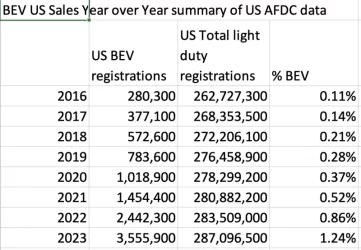
While not as exciting or current as the latest speculation on new car sales trends, this data shows that BEV as a cumulative number of registrations has been steadily increasing year over year from 2016 through 2023. Also of interest, maybe only to me, is what percentage of the US light duty vehicle fleet is using each powertrain. Based on my math adding the individual fuel type columns, BEV's as a percentage of the US light duty fleet is also steadily rising. I have pasted a screenshot of my spreadsheet summary below.